Connect your metabolomic data with context; using dynamic combinations of metabolite relationships to help test your biological hypotheses.
Use biochemical, structural similarity, mass spectral similarity, and empirical knowledge to link multivariate biochemical information.
*Try reloading the webpage if you do not see and interactive visualization above.
Meahwhile creating interactive networks for data mapping. For example:
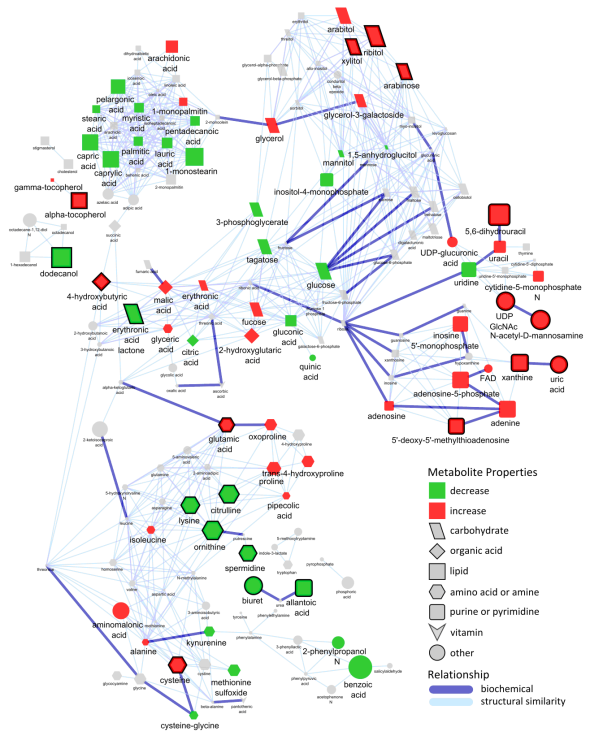
Metabolomic changes between two tissues shown in the context of biochemical and structural similarity relationships.
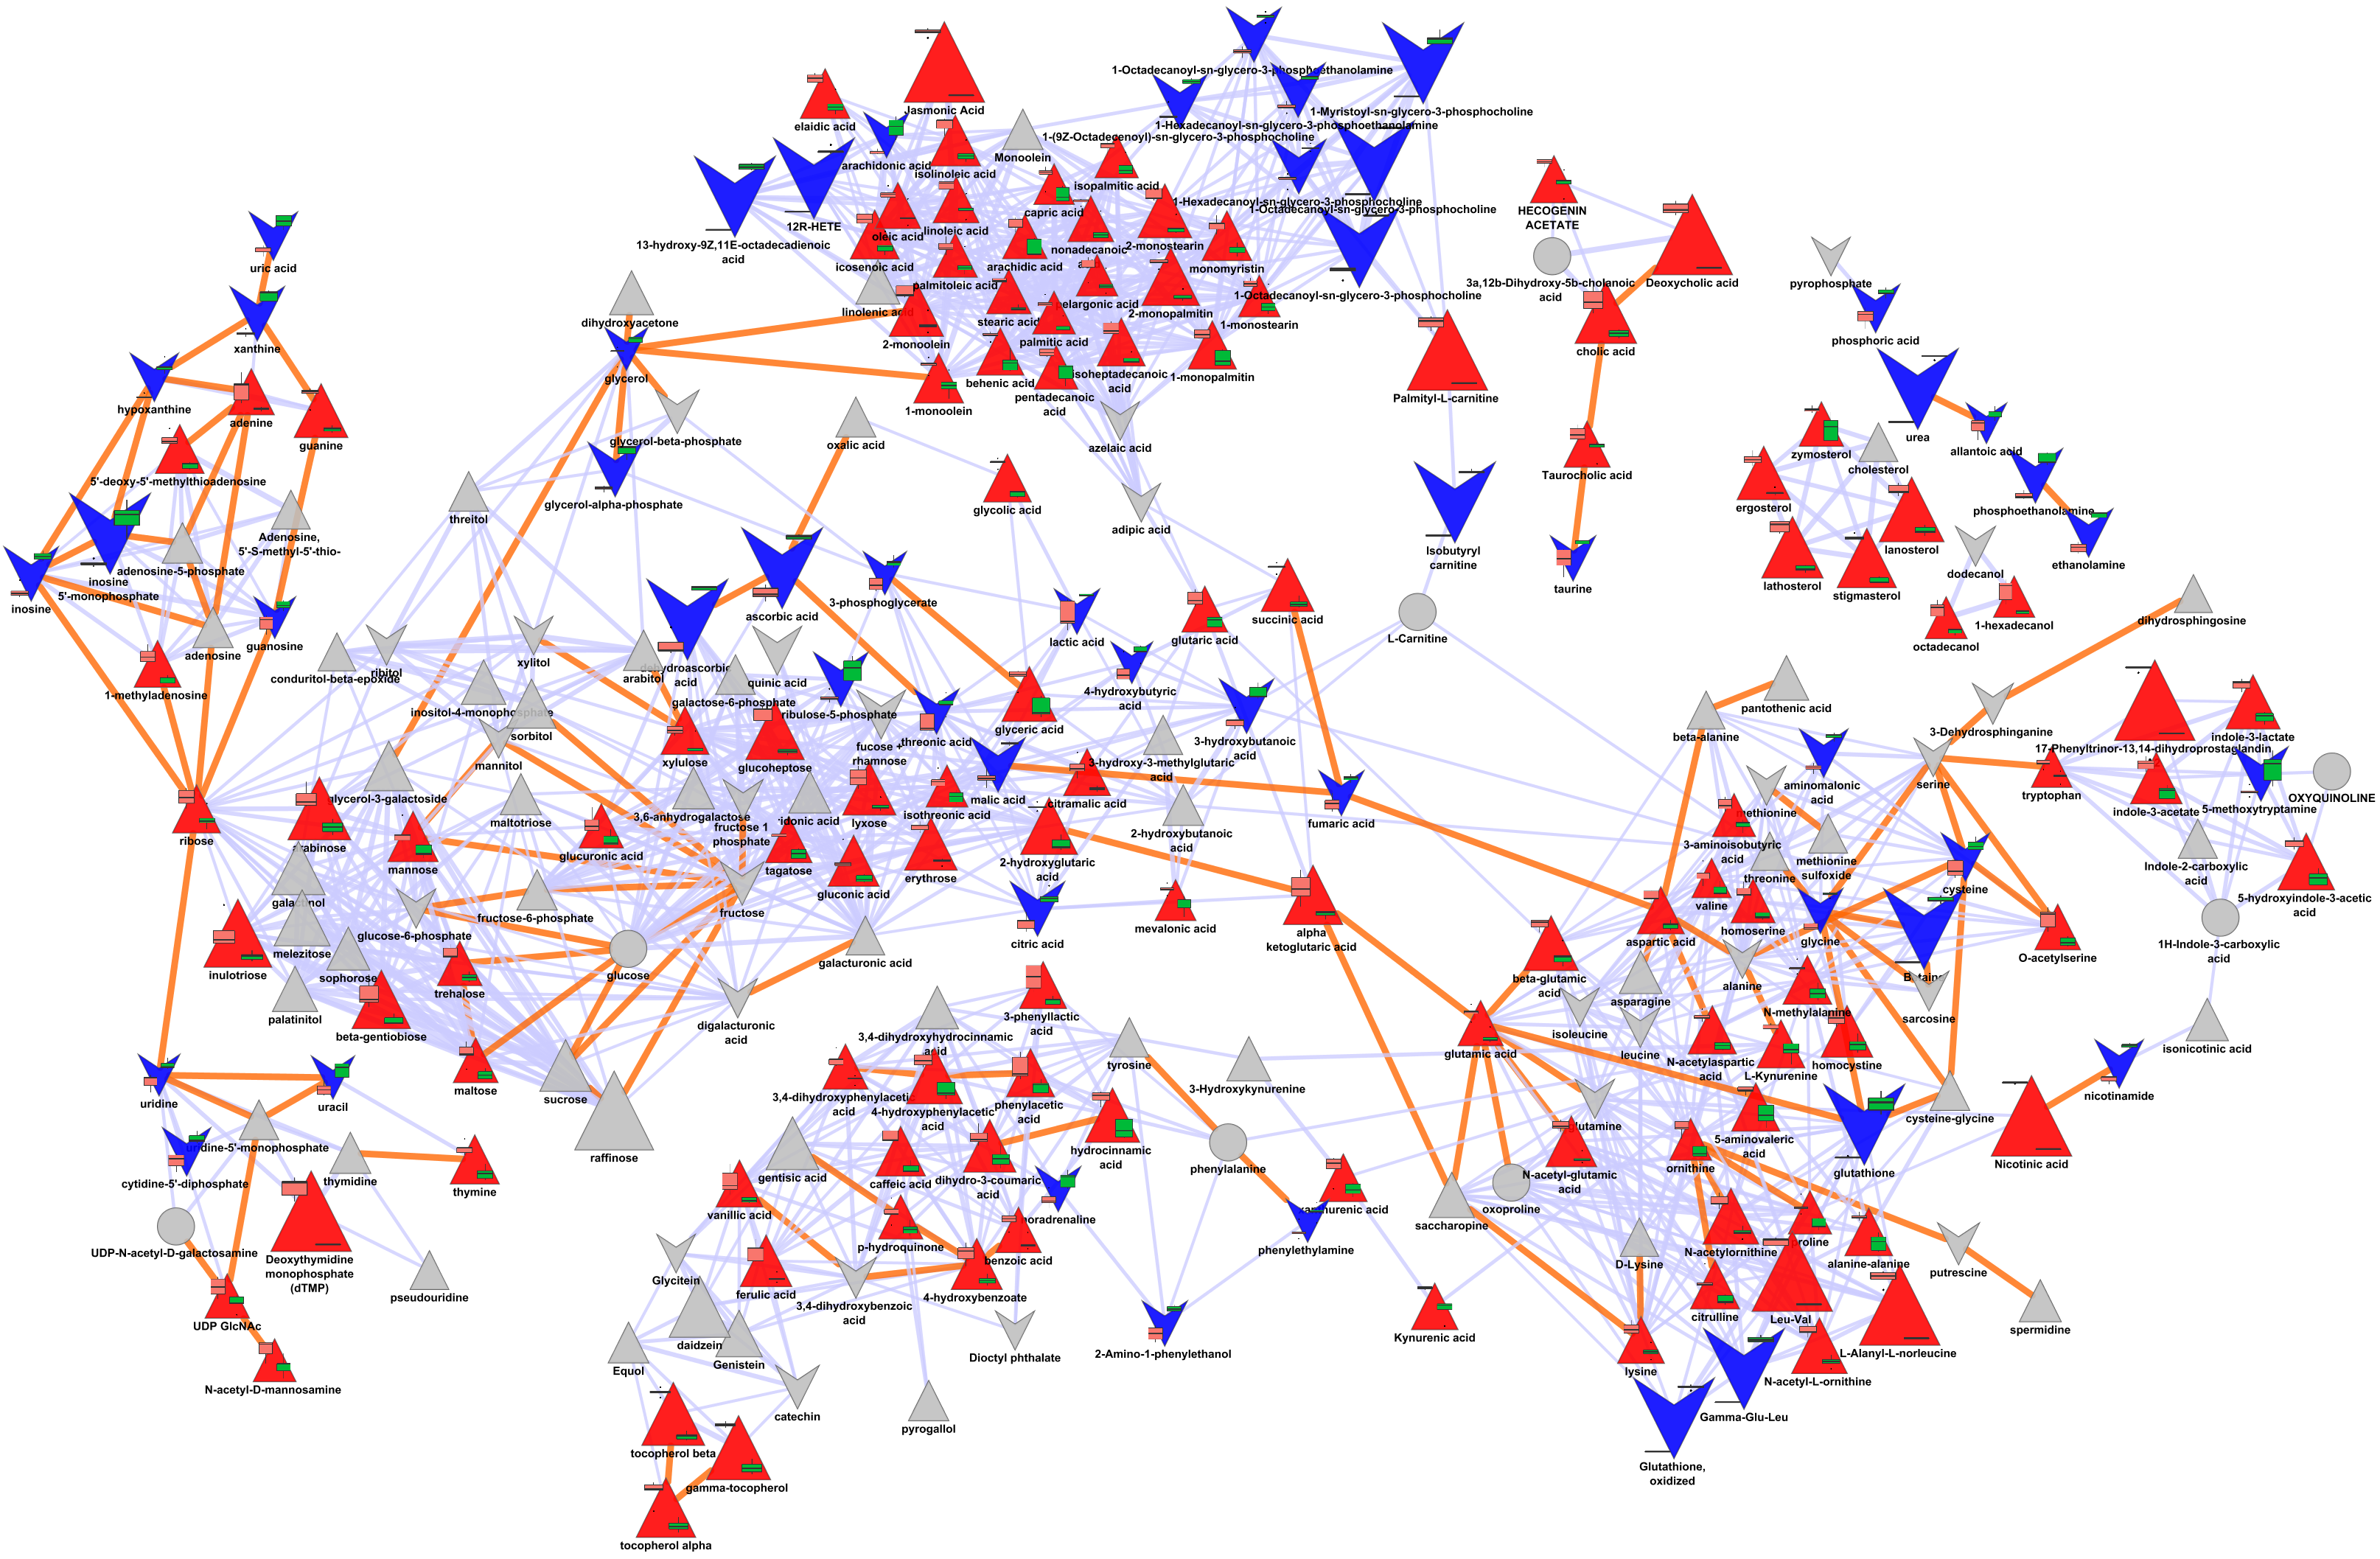
Biochemical and structural similarity network between > 1200 small molecules.

Chemical similarity based metabolomic network.

Biochemical and structural similarity network between metabolic clusters.
Biochemical and structural similarity network.

Metabolomic network incorporating structurally unknown molecules.

Biochemical and structural similarity network.
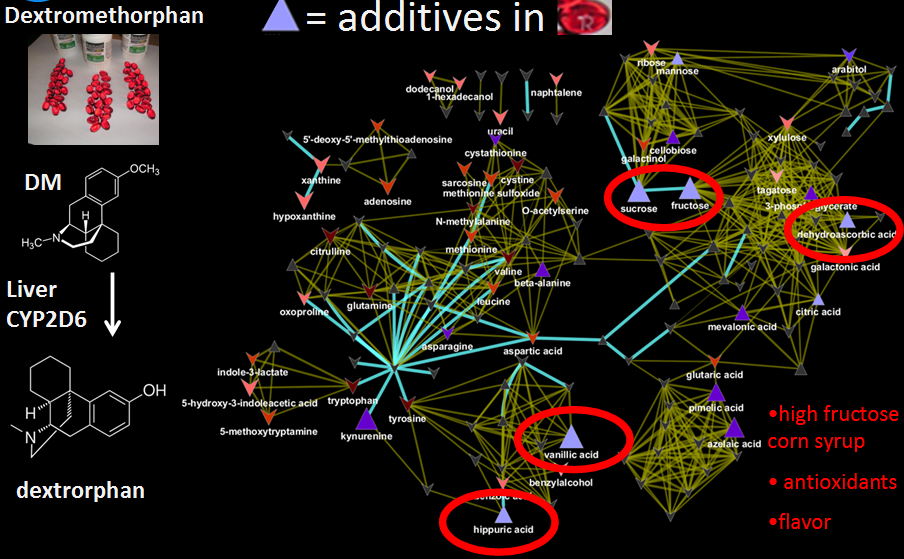
Mass spectral and empirical correlation network.

Partial correlation metabolic network.

Partial correlation metabolic network displaying differential response to drug treatments.
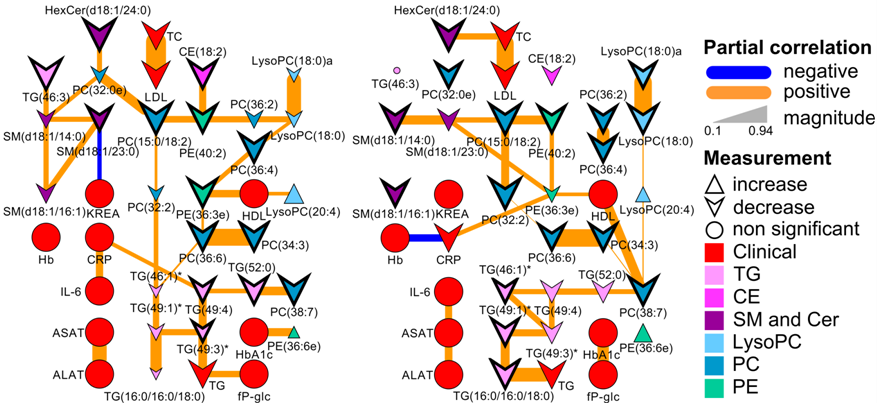
Partial correlation metabolic network displaying drug treatment effects.

Correlation network between lipids.

Partial correlation network for time-course data.

Partial correlation network for time-course data converted to area under the curves (AUC).

Biochemical and structural similarity network between metabolic clusters.
Biochemical and structural similarity network.
Metabolomic network incorporating structurally unknown molecules.
Biochemical and structural similarity network.
Mass spectral and empirical correlation network.
Partial correlation metabolic network.
Partial correlation metabolic network displaying differential response to drug treatments.
Partial correlation metabolic network displaying drug treatment effects.
Correlation network between lipids.
Partial correlation network for time-course data.
Partial correlation network for time-course data converted to area under the curves (AUC).
Partial correlation metabolic network displaying drug treatment effects.
Correlation network between lipids.
Partial correlation network for time-course data.
Partial correlation network for time-course data converted to area under the curves (AUC).
Partial correlation network for time-course data.
Partial correlation network for time-course data converted to area under the curves (AUC).
Check back soon for more examples and tutorials.